


S&P Azərbaycanın kredit reytinqini “BB+/B” səviyyəsində təsdiqlədi


“Standard&Poors” (S&P) beynəlxalq reytinq agentliyi Azərbaycanın reytinqinə yenidən baxıb. Bu barədə agentliyin açıqladığı məlumatda qeyd edilir.
Məlumata görə, Azərbaycanın xarici və yerli valyutada uzunmüddətli və qısamüddətli suveren kredit reytinqini “BB+/B” səviyyəsində müəyyən edib. Reytinq üzrə proqnoz isə sabitdir.
S&P aşağı neft qiymətləri fonunda Azərbaycan üçün orta iqtisadi göstəricilərin qeydə alınacağını proqnozlaşdırır: “2018-ci ildə zəifləməyə baxmayaraq fiskal balans olduğu kimi qalacaq. 2019-2022-ci illərdə iqtisadi artım davam edəcək və xarici balansda az da olsa profisit qeydə alınacaq”.
Azerbaijan Ratings Affirmed At 'BB+/B'; Outlook Stable
-With a relatively low oil price outlook, we expect moderate economic growth over 2019-2022 and smaller external surpluses.
-Although materially weaker than 2018, we expect fiscal balances to remain controlled and note the -government's strong net asset position.
-We are affirming our 'BB+/B' foreign and local currency ratings on Azerbaijan.
-The outlook is stable.
S&P Global Ratings affirmed the long- and short-term foreign and local currency sovereign credit ratings on Azerbaijan at 'BB+/B'. The outlook on the long-term ratings is stable.
OUTLOOK
The stable outlook indicates our view of balanced risks to the ratings over the next 12 months; we expect that the authorities will continue to focus on macroeconomic stability, including fiscal management through a period of lower oil prices.
We could lower the ratings if Azerbaijan's economic prospects weakened compared to our present forecast. This could happen, for example, as a result of delays affecting the Shah Deniz II (SDII) gas project, leading to reduced investments and ultimately lower exports. It could also occur if oil production declined substantially faster than expected.
We could also lower the ratings if external vulnerabilities were to escalate, resulting for instance in a decline in central bank reserves, or if domestic political risks increased in response to a significant recent decline in real incomes, possibly restricting the government's ability to control spending.
We could consider an upgrade if there were greater diversification in the economy over time, in particular in Azerbaijan's export profile. This could potentially reduce volatility in Azerbaijan's external terms-of-trade. If this was to occur in tandem with a strengthening net external position and improved external stock data provision, then we could also consider these factors together as supportive of an upgrade.
RATIONALE
Our ratings on Azerbaijan are primarily supported by the sovereign's strong fiscal position, which is underpinned by the large stock of foreign assets accumulated in the sovereign wealth fund, SOFAZ. The ratings are constrained by weak institutional effectiveness, the narrow and concentrated economic base, limited monetary policy flexibility, and only partial and less-than-timely data on Azerbaijan's international investment position.
Institutional and Economic Profile: Tepid economic growth is expected In our view, Azerbaijan's institutions remain weak and policy changes will be limited.While this dynamic will likely mean Azerbaijan's economic performance stays below potential, we expect economic stability to be at the top of authorities' priorities.
Economic growth will moderately recover but remain dependent on oil industry trends and public investment.
We anticipate limited changes in policy direction over the forecast period and, following the disruption caused by the 2014/2015 oil price shock, we expect the authorities will continue to prioritize preserving economic stability. We note that SOFAZ assets, the government's wealth fund, have increased materially over the past few years, buoyed by higher oil prices. We have recently lowered our oil price assumptions leading us to slightly reduce our growth expectations as consumption and investment levels are likely to fall in tandem; we expect oil prices to be some 24% lower than in 2018.
In our opinion, Azerbaijan's institutions remain weak. They are characterized by highly centralized decision-making and lack transparency, which can make policy responses difficult to predict. Political power remains concentrated in the president and his administration, with limited checks and balances.
We also see geopolitical risks stemming from the unresolved dispute with Armenia over the Nagorno-Karabakh region. The conflict last flared up in 2016. While it is unlikely to escalate again in the medium term--and despite some indications of the potential for dialogue--the prospects for resolution remain remote, in our opinion.
Our expectation of a substantial fall in oil prices in 2019 versus 2018 will likely weigh on Azerbaijan's economic outlook. Factors that characterized 2016 and 2017 could resurface: namely, cautious public investment and weak consumption dynamics following a material weakening of the Azerbaijani manat leading to weaker confidence and purchasing power.
Still, we expect the country's economic performance to gradually improve over the next few years, and we forecast average growth of just under 3% through
2022. Growth should be supported by a steady recovery in consumption and a cautious increase in business confidence following the initial delivery of the large SDII gasfield project, which saw Azeri gas delivered first to Turkey and then to Europe, and was officially launched in early July 2018. Over the next four years, we anticipate gas exports will gradually rise as the project reaches full capacity, which should strengthen broader economic dynamics.
Longer term, question marks have been raised over the production from the Azeri-Chirag-Gunashli (ACG) field (Azerbaijan's biggest field), from which two oil majors have announced they wish to withdraw. With declining production anticipated--given the field's age--further investment, and therefore production, is uncertain, although production sharing agreements extend to 2050. We assume flat production for all Azerbaijan's hydrocarbon production, with SDII and Absheron fields expected to offset declining ACG production.
Flexibility and Performance Profile: A strong public balance sheet partly offsets the weak banking sector and limited monetary flexibility The strength of Azerbaijan's fiscal balance sheet is the main factor supporting the ratings.
We expect lower oil prices will pressure fiscal and external balances, but that they will remain in a small surplus throughout the next four years. Monetary policy effectiveness remains significantly constrained by the weak domestic banking system, underdeveloped capital markets, high dollarization, and lack of operational independence by the Central Bank of Azerbaijan (CBA).
Azerbaijan's strong fiscal balance sheet is the main factor supporting the sovereign ratings. It is underpinned by the large foreign assets accumulated in the sovereign wealth fund, SOFAZ. We only count SOFAZ's liquid assets in our calculations; we exclude the 20% of GDP equivalent exposures that might be hard to liquidate if needed, such as the fund's domestic investments and certain equity exposures. Even so, we forecast SOFAZ's liquid assets at about 60% of GDP at year-end 2019 and the sovereign to remain in an overall net-asset position averaging 37% of GDP over our four-year forecast horizon.
During the forecast period the net-asset position will be underpinned by recurrent general government surpluses. We note they are lower than we previously assumed following our recent revision to oil price assumptions. We now project that Azerbaijan will post fiscal surpluses averaging 2% of GDP in these years, down from 3%. We also expect the ongoing adoption of fiscal rules that place limits on the pace of expenditure growth will help maintain fiscal control, although their credibility remains to be tested.
We project a stronger budgetary outcome for 2018 than in the official government forecast, at around 7% of GDP. The 2018 budget was originally based on oil being $45 per barrel, whereas the actual average was close to $72.
Disclosed SOFAZ assets were nearly $39 billion, up from $36 billion at end-2017. Further, we understand that the capital expenditure budget was underspent through to the third-quarter of 2018.
We do not expect the launch of SDII and its expansion over the next few years to have any substantial effect on the general government budget. This is because Azerbaijan will mostly use the profits from planned gas exports to pay down the debt of the Southern Gas Corridor--a government special-purpose vehicle that financed a substantial part of the project and received foreign financing with government guarantees.
Nevertheless, over the medium term Azerbaijan will benefit from the amended profit-sharing agreement reached last year for the main ACG oilfield. In addition to potential production expansion, under the contract Azerbaijan receives a bonus payment of $3.6 billion over eight years in equal instalments, which will be deposited into SOFAZ.
In line with stronger projected fiscal performance, we forecast the stock of general government debt as a share of GDP will start declining. Over the past two years, it has expanded at a much faster pace than the headline budgetary balances imply. This has been mainly due to contingent liabilities emerging in the banking system; the government contributed substantially to the majority state-owned International Bank of Azerbaijan (IBA) in 2016 by explicitly assuming the bank's liabilities of US$2.3 billion. The authorities currently plan to privatize IBA, but the timeline and details remain unclear. We note that the European Bank for Reconstruction and Development could potentially participate in the privatization process.
We believe that most risks to the sovereign from the weak banking system have already materialized, so we see additional contingent liabilities as limited. Even though the financial system remains weak, we forecast it will gradually strengthen in tandem with improved growth.
Mirroring developments on the fiscal side, Azerbaijan's external position remains strong on a stock basis and we expect the country's liquid external assets to keep exceeding external debt. Azerbaijan will remain vulnerable to potential terms-of-trade volatility. Also, the available data for Azerbaijan's balance of payments and international investment positions is limited--which possibly underestimates external risks.
Our ratings on Azerbaijan remain constrained by the limited effectiveness of its monetary policy. We believe that the increased flexibility of the manat exchange rate since 2015 has helped lessen external pressures. Since April 2017, the exchange rate has stabilized at 1.7 manat per U.S. dollar, suggesting interventions in the foreign exchange (FX) market. Even so, we do not consider the current arrangement a conventional peg; in our view, if oil prices become less favorable the authorities will allow the exchange rate to adjust promptly to avoid the substantial loss of FX reserves as happened in 2015, and which saw the CBA ultimately abandoning the peg in December that year.
Nevertheless, apart from setting the country's foreign exchange regime and intervening, the CBA's ability to influence economic developments remains considerably constrained. We estimate that resident deposit dollarization remains more than 60%, which we think severely limits the central bank's influence on domestic monetary conditions. In addition, Azerbaijan's local currency debt capital market remains small and underdeveloped and CBA's operational independence remains limited.
KEY STATISTICS
Table 1
Azerbaijan Selected Indicators | |||||||||
AZN. Mil. | 2013 | 2014 | 2015 | 2016 | 2017 | 2018 | 2019 | 2020 | 2021 |
Economic indicators (%) | |||||||||
Nominal GDP (bil. LC) | 58 | 59 | 54 | 60 | 70 | 82 | 80 | 84 | 88 |
Nominal GDP (bil. $) | 74 | 75 | 53 | 38 | 41 | 48 | 46 | 46 | 46 |
GDP per capita (000s $) | 7.9 | 7.9 | 5.5 | 3.9 | 4.2 | 4.8 | 4.6 | 4.5 | 4.5 |
Real GDP growth | 5.8 | 2.8 | 1.1 | (3.1) | 0.1 | 1.1 | 2.3 | 3.0 | 3.1 |
Real GDP per capita growth | 4.4 | 1.5 | (0.1) | (4.2) | (1.0) | 0.2 | 1.5 | 2.2 | 2.3 |
Real investment growth | 19.4 | 1.4 | (5.0) | (15.0) | 4.5 | 1.1 | 2.2 | 2.3 | 2.3 |
Investment/GDP | 25.7 | 26.6 | 27.9 | 25.7 | 24.1 | 22.5 | 24.5 | 25.1 | 25.4 |
Savings/GDP | 42.2 | 40.2 | 27.5 | 22.1 | 28.3 | 32.4 | 27.3 | 27.2 | 27.3 |
Exports/GDP | 48.4 | 43.3 | 37.8 | 46.4 | 48.7 | 52.9 | 46.6 | 46.0 | 45.3 |
Real exports growth | 1.5 | (1.1) | (0.5) | (1.4) | (5.0) | 2.3 | 3.0 | 4.1 | 4.2 |
Unemployment rate | 5.0 | 4.9 | 5.0 | 5.0 | 5.0 | 5.0 | 5.0 | 5.0 | 5.0 |
External indicators (%) | |||||||||
Current account balance/GDP | 16.5 | 13.6 | (0.4) | (3.6) | 4.1 | 10.0 | 2.8 | 2.1 | 1.9 |
Current account balance/CARs | 31.7 | 28.3 | (1.0) | (7.1) | 7.6 | 17.2 | 5.3 | 4.0 | 3.8 |
CARs/GDP | 52.1 | 47.9 | 42.4 | 50.5 | 54.6 | 58.1 | 52.3 | 52.0 | 51.4 |
Trade balance/GDP | 27.8 | 25.2 | 11.0 | 11.1 | 15.0 | 19.7 | 14.7 | 13.9 | 13.3 |
Net FDI/GDP | 1.5 | 3.2 | 1.6 | 5.1 | 0.7 | 1.0 | 1.0 | 1.0 | 1.0 |
Net portfolio equity inflow/GDP | 0.0 | 0.0 | 0.0 | (0.0) | (0.0) | (1.5) | (1.5) | (1.5) | (1.5) |
Gross external financing needs/CARs plus usable reserves | 60.2 | 61.3 | 78.5 | 107.3 | 96.3 | 81.7 | 88.9 | 89.8 | 89.9 |
Narrow net external debt/CARs | (92.4) | (86.9) | (85.1) | (66.9) | (67.3) | (63.6) | (76.7) | (80.4) | (83.9) |
Narrow net external debt/CAPs | (135.2) | (121.3) | (84.3) | (62.5) | (72.8) | (76.8) | (81.0) | (83.8) | (87.2) |
Net external liabilities/CARs | (78.8) | (65.7) | (47.5) | (14.0) | (20.2) | (29.0) | (40.3) | (45.6) | (50.7) |
Net external liabilities/CAPs | (115.3) | (91.6) | (47.0) | (13.0) | (21.8) | (35.0) | (42.5) | (47.5) | (52.6) |
Short-term external debt by remaining maturity/CARs | 10.1 | 13.6 | 25.5 | 28.3 | 21.1 | 14.4 | 17.4 | 19.3 | 21.1 |
Usable reserves/CAPs (months) | 5.3 | 6.6 | 7.3 | 2.9 | 2.3 | 2.8 | 3.3 | 3.6 | 3.8 |
Usable reserves (mil. $) | 14,152 | 13,758 | 5,017 | 3,974 | 5,335 | 6,294 | 6,754 | 7,211 | 7,671 |
Fiscal indicators (general government; %) | |||||||||
Balance/GDP | 1.7 | 2.8 | (4.9) | (1.2) | (1.6) | 7.0 | 2.0 | 2.0 | 2.0 |
Change in net debt/GDP | (2.5) | 4.2 | (18.9) | 13.6 | 5.8 | (7.3) | (4.7) | (5.0) | (5.5) |
Primary balance/GDP | 1.9 | 3.0 | (4.6) | (0.8) | (0.9) | 7.7 | 2.7 | 2.7 | 2.7 |
Revenue/GDP | 39.9 | 39.1 | 33.9 | 34.3 | 34.3 | 35.0 | 33.0 | 33.0 | 33.0 |
Expenditures/GDP | 38.2 | 36.3 | 38.7 | 35.4 | 35.9 | 28.0 | 31.0 | 31.0 | 31.0 |
Interest/revenues | 0.6 | 0.4 | 0.8 | 1.3 | 2.0 | 2.1 | 2.1 | 2.1 | 2.0 |
Debt/GDP | 6.2 | 8.3 | 22.3 | 36.6 | 38.5 | 31.3 | 32.7 | 31.9 | 30.6 |
Debt/revenues | 15.5 | 21.2 | 65.9 | 106.8 | 112.2 | 89.3 | 99.0 | 96.5 | 92.7 |
Net debt/GDP | (44.2) | (39.4) | (61.6) | (41.8) | (30.2) | (33.3) | (38.6) | (41.9) | (45.2) |
Liquid assets/GDP | 50.4 | 47.6 | 83.9 | 78.4 | 68.7 | 64.5 | 71.3 | 73.8 | 75.8 |
Monetary indicators (%) | |||||||||
CPI growth | 2.4 | 1.4 | 4.0 | 12.4 | 12.9 | 2.5 | 3.5 | 4.0 | 4.2 |
GDP deflator growth | 0.5 | (1.3) | (8.9) | 14.7 | 16.0 | 15.0 | (4.0) | 1.4 | 2.5 |
Exchange rate, year-end (LC/$) | 0.78 | 0.78 | 1.56 | 1.77 | 1.70 | 1.70 | 1.79 | 1.87 | 1.97 |
Banks' claims on resident non-gov't sector growth | 11.9 | 20.5 | 20.7 | (28.3) | (35.7) | 0.0 | 5.0 | 5.0 | 5.0 |
Banks' claims on resident non-gov't sector/GDP | 29.1 | 34.6 | 45.3 | 29.2 | 16.2 | 13.9 | 14.9 | 15.0 | 14.9 |
Foreign currency share of claims by banks on residents | N/A | N/A | N/A | N/A | N/A | N/A | N/A | N/A | N/A |
Foreign currency share of residents' bank deposits | 32.9 | 36.2 | 76.4 | 64.4 | 67.6 | N/A | N/A | N/A | N/A |
Real effective exchange rate growth | 0.9 | 11.5 | (25.0) | (17.0) | 3.2 | N/A | N/A | N/A | N/A
|
PULSUZ SEMİNARA QATIL, QAZANMAĞI ÖYRƏN!
© Report

Müştərilərin xəbərləri


SON XƏBƏRLƏR
-
5 gün sonra
Şəxsiyyət vəsiqəsi ilə, zaminsiz, arayışsız kreditə elə indi müraciət et ®
- 5 gün sonra
- 1 gün sonra
-
- 1 gün əvvəl
-
1 gün əvvəl
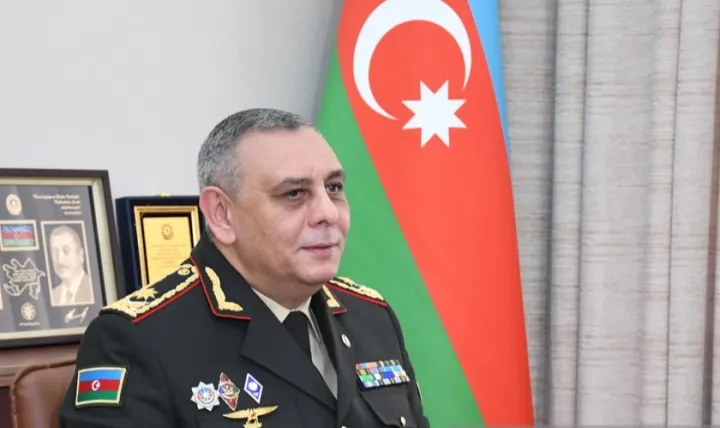
Azərbaycanda ödənişli hərbi xidmət olacaqmı? Generaldan konkret cavab
- 1 gün əvvəl
- 1 gün əvvəl
- 1 gün əvvəl
- 1 gün əvvəl
-
2 gün əvvəl
Xərçəng iddiası ilə bağlı məhkəmə işində “Bayer” şirkətinin xeyrinə qərar verildi
- 2 gün əvvəl
-
2 gün əvvəl
Qazaxıstan Azərbaycandan aviasiya yanacağı idxalına başlaya bilər

Son Xəbərlər
Gəlirli strategiyanı CFI ilə yarat - TİCARƏTƏ BAŞLA ®


Azvak.az-da yeni iş elanları
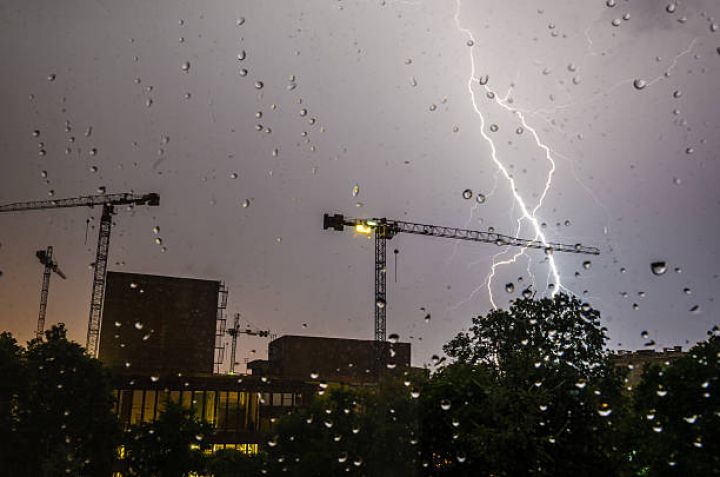
İyunun 28-də gözlənilən hava şəraiti


“Neqodnı” olan vətəndaşlara çağırış edirəm: "Vaxtında komissiyadan keçin ki, biz sizin haqqınızda hər hansı tədbirləri həyata keçirməyək"

Qızıl gətir, sərfəli kredit götür!

ABŞ, Trampın Tehranı Hörmüz boğazında atəşkəsi pozmaqda ittiham etməsindən sonra İrana zərbələr endirib
Ən çox oxunanlar


Ağ Evdən OpenAI-a GPT-5.6 göstərişi

Qazaxıstan Azərbaycandan aviasiya yanacağı idxalına başlaya bilər

Gürcüstan Azərbaycandan 2 milyard kubmetrdən çox təbii qaz tədarükünə dair zəmanət əldə edib

İyunun 27-nin hava proqnozu - LEYSAN, GÜCLÜ KÜLƏK GÖZLƏNİLİR


Sahibkarlar ən çox nədən şikayət edir? - Sahibkarların gömrükdə ən çox "ilişdiyi" məsələ açıqlandı

Bakıda və bölgələrdə külək güclənəcək - XƏBƏRDARLIQ


SON XƏBƏRLƏR
-
5 gün sonra
Şəxsiyyət vəsiqəsi ilə, zaminsiz, arayışsız kreditə elə indi müraciət et ®
- 5 gün sonra
- 1 gün sonra
-
- 1 gün əvvəl
-
1 gün əvvəl
Azərbaycanda ödənişli hərbi xidmət olacaqmı? Generaldan konkret cavab
- 1 gün əvvəl
- 1 gün əvvəl
- 1 gün əvvəl
- 1 gün əvvəl
-
2 gün əvvəl
Xərçəng iddiası ilə bağlı məhkəmə işində “Bayer” şirkətinin xeyrinə qərar verildi
- 2 gün əvvəl
-
2 gün əvvəl
Qazaxıstan Azərbaycandan aviasiya yanacağı idxalına başlaya bilər